How to make a linked double X-axis plot in Origin when the two variables have an inverse relation?
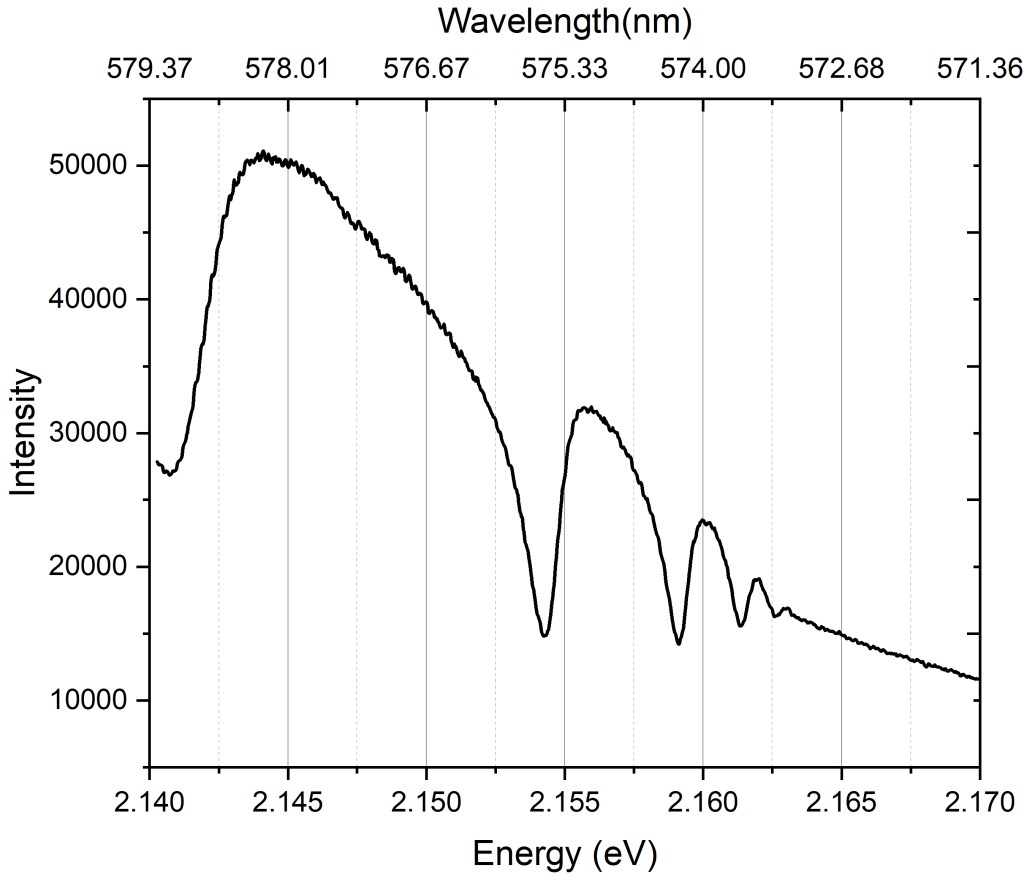
This video illustrates how you can make a double X-axis plot where the two X-axes are linked, meaning that one axis is a function of the other. This would be useful when you need to represent data as a function of two different but dependent variables. For example, I often need to plot photoluminescence intensity versus energy and wavelength on the same graph. Energy and wavelength are inversely related by the formula:

The example graph is shown below: